Warehouse temperature and humidity monitoring solution
Ngày: 22/03/2025
INTRODUCTION
IoT Globiots is a comprehensive monitoring system (hardware and software) of temperature and humidity parameters in warehouses of goods and materials using smart sensor technology connecting all things.

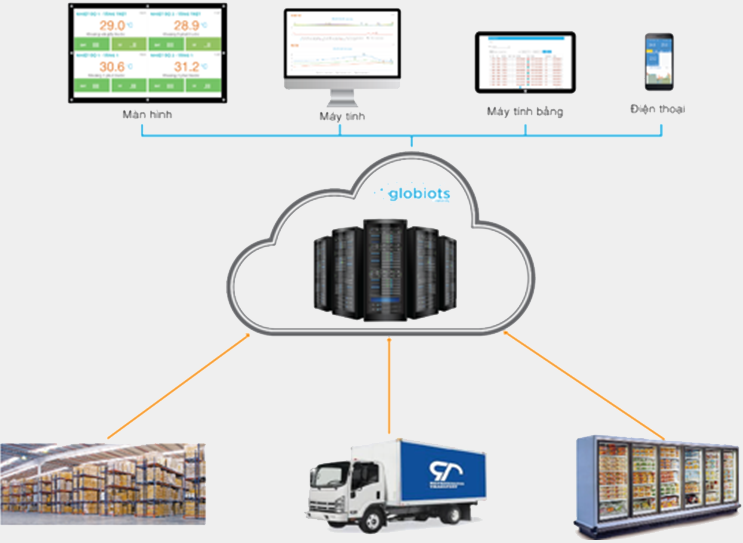
Temperature and humidity monitoring system model using IoT Globiots
The following types of warehouses apply IoT Globiots solution:

Types of warehouses that need temperature and humidity monitoring
SOLUTION FEATURES:
.png)
DEPLOYMENT STEPS:
Quick deployment in 2 steps:
Step 1: Connect wireless sensors to iConnector
.png)
Connection diagram of wireless sensors measuring temperature and humidity with iConnector
Install RF wireless sensors measuring temperature and humidity within the transmission range of the wireless receiver. Wireless sensors operate on batteries for up to 10 years. Each RF receiver can connect up to 30 wireless sensors. The RF receiver can be integrated in the iConnector or connected to the iConnector via RS485 port.
Set up the hardware to connect the iConnector to a private server or cloud server: install a SIM for the 3G iConnector or plug in a LAN cable for the Ethernet iConnector or set up a wifi network for the wifi iConnector.
.png)
Diagram of connecting iConnector to the server with IoT Globiots software installed and connecting IoT Globiots to display devices
Step 2: Configure the system, devices, and parameters remotely via the web
Power up all system devices then log in to the web browser (Google Chrome, Firefox...) with the provided ULR, user and password to configure iConnector, configure sensors, parameters, warnings, events, dashboard interface, report interface, automatic email, automatic SMS, users and user groups and then synchronize the configurations to the remote iConnector. After the configuration is complete, customers can access and use the software to monitor temperature and humidity.
ANALYSIS REPORT
Dashboard
.png)
Dashboard displays current, today, yesterday key parameters
Temperature, humidity history chart
.png)
Historical chart of parameters in selected time period
♦ Display historical chart of parameters according to selected time
♦ View parameter values at any time by mouse cursor
♦ Zoom in, zoom out chart to see details
♦ Click on parameter name to temporarily turn off/show parameter chart
♦ Send email or export to CSV file
♦ Create multiple different chart and report tabs
Report on Android smartphone, tablet
.png)
Reports on tablets and smartphones
♦ Similar to the dashboard on the web but the interfaces will be arranged vertically to suit the screens of tablets and smartphones
♦ Events, alerts are also displayed and notified on the Android application


.png)
.png)
.png)
.png)
.png)
.png)
